Publication T2.3.1_Development of User-Interfaces – Platforms and Apps
The goal of this deliverable was to develop and design user-friendly interfaces in addition to the decentralized database based on the blockchain technology. Due to the different pilots, regions and their requirements, different applications will be needed. This also includes the visualisation for the user of the sold solar and wind energy from his own plant, the purchase of the still required electricity and the monitoring of the generation plants.
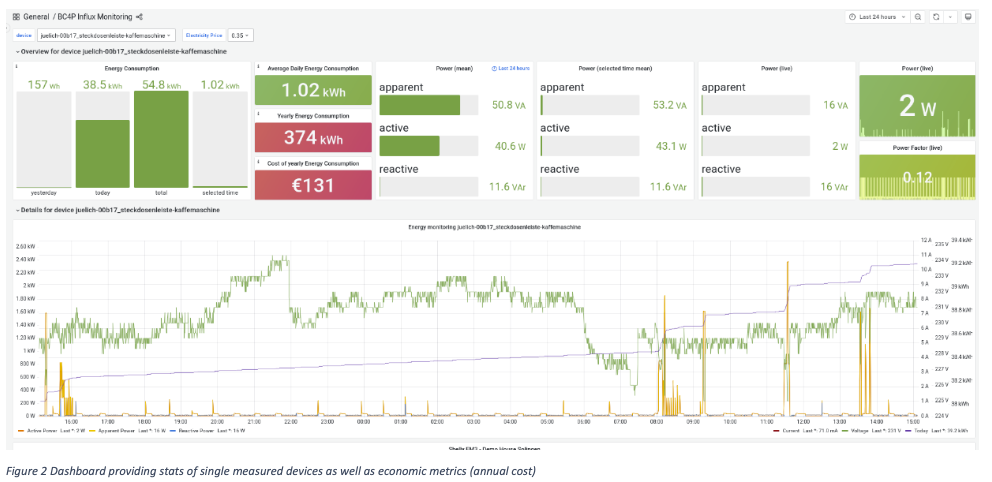
With these objectives in mind, FH Aachen has created a Grafana dashboard for the energy statistics that are being collected from their infrastructure. This also includes setting up the infrastructure of collecting the data. This dashboard and interface will also be used for energy dashboards at other partners, e.g. with energy data of Climate Cities, TIORC and PXL.
Howest and FH Aachen have been working together on various interfaces and visualisations of the assets within the blockchain and the transactions that happen between users of the blockchain. Therefore, they also discussed together the implications on the underlying structure of the blockchain itself.